On this page
Examples
It's easiest to learn a new framework by digging into examples.
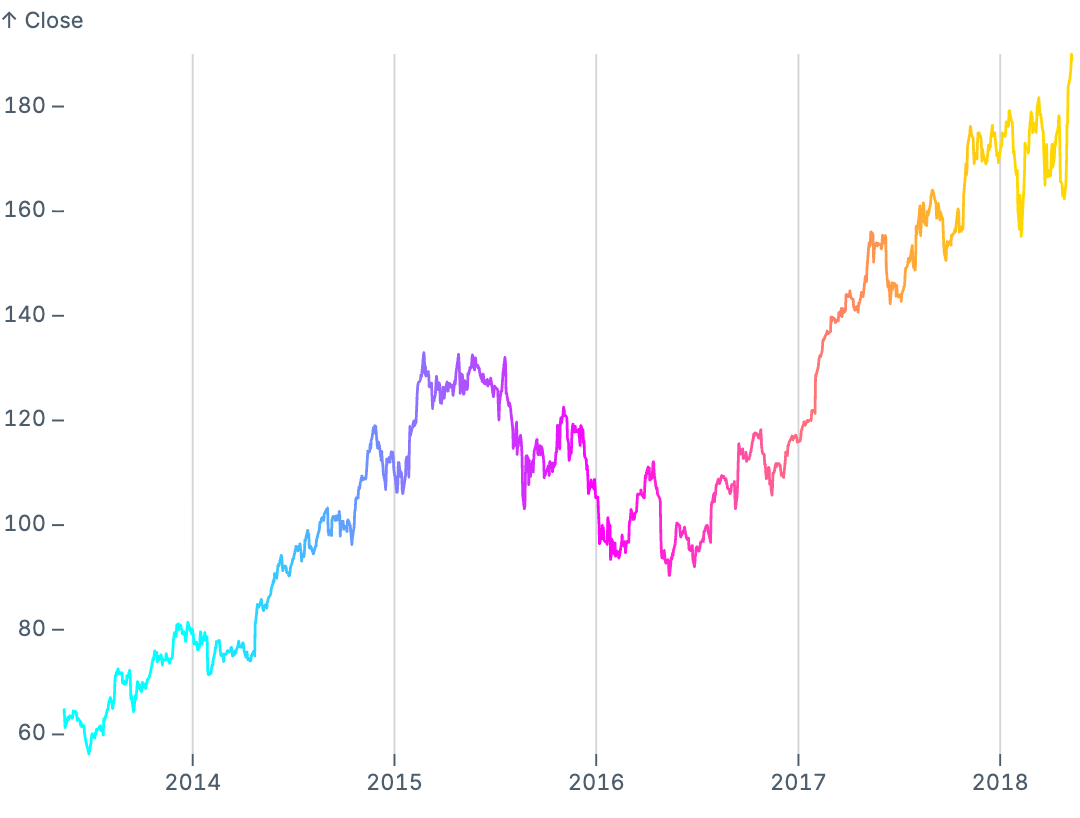
Gradient line
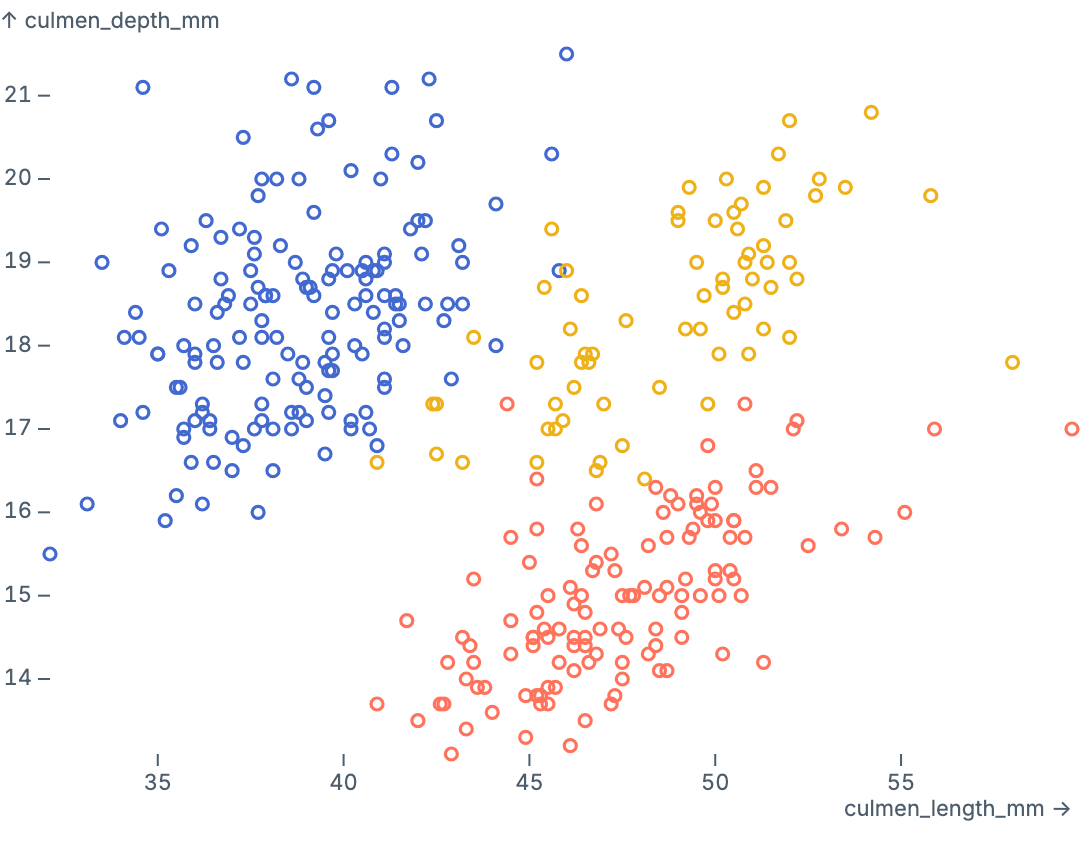
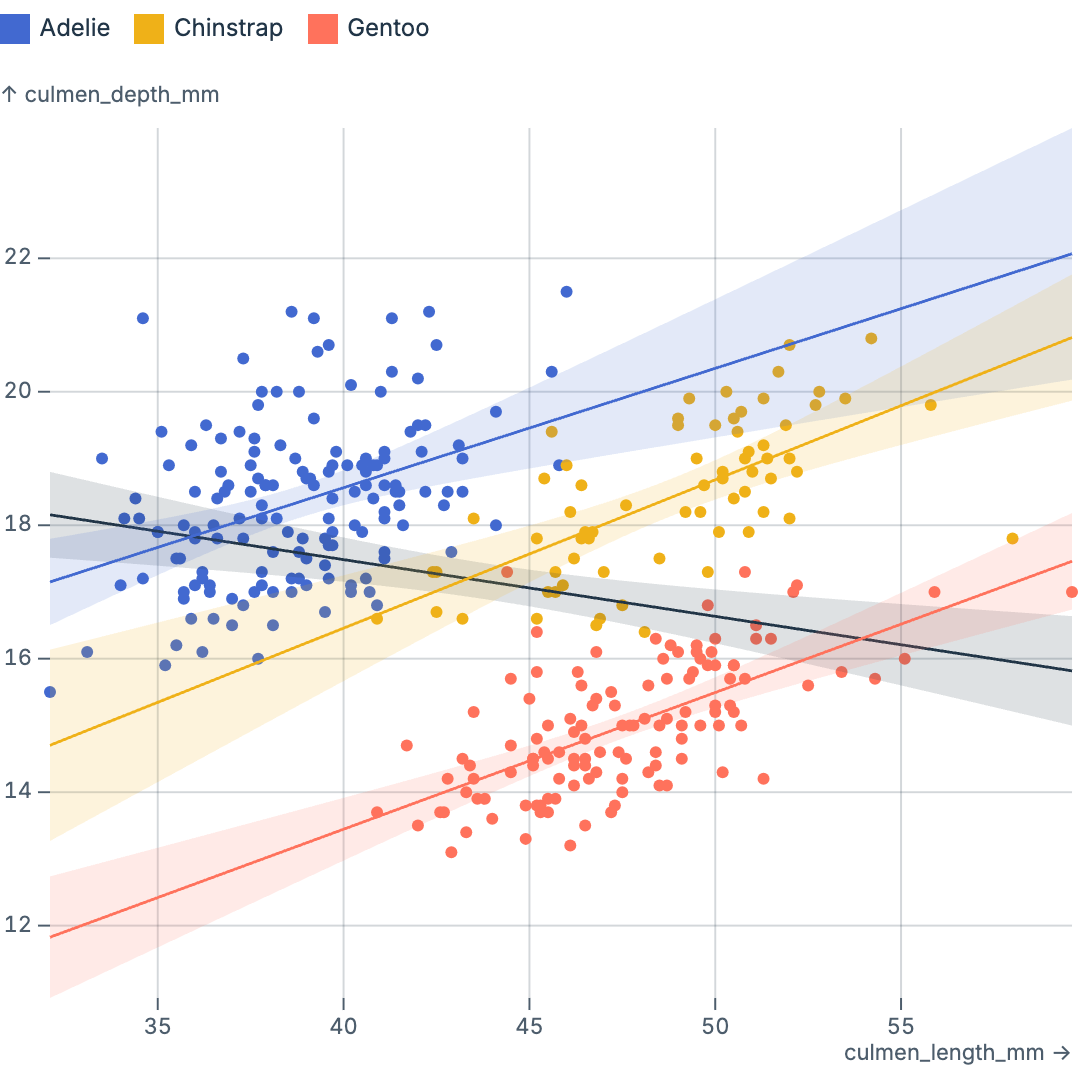
Color scatterplot
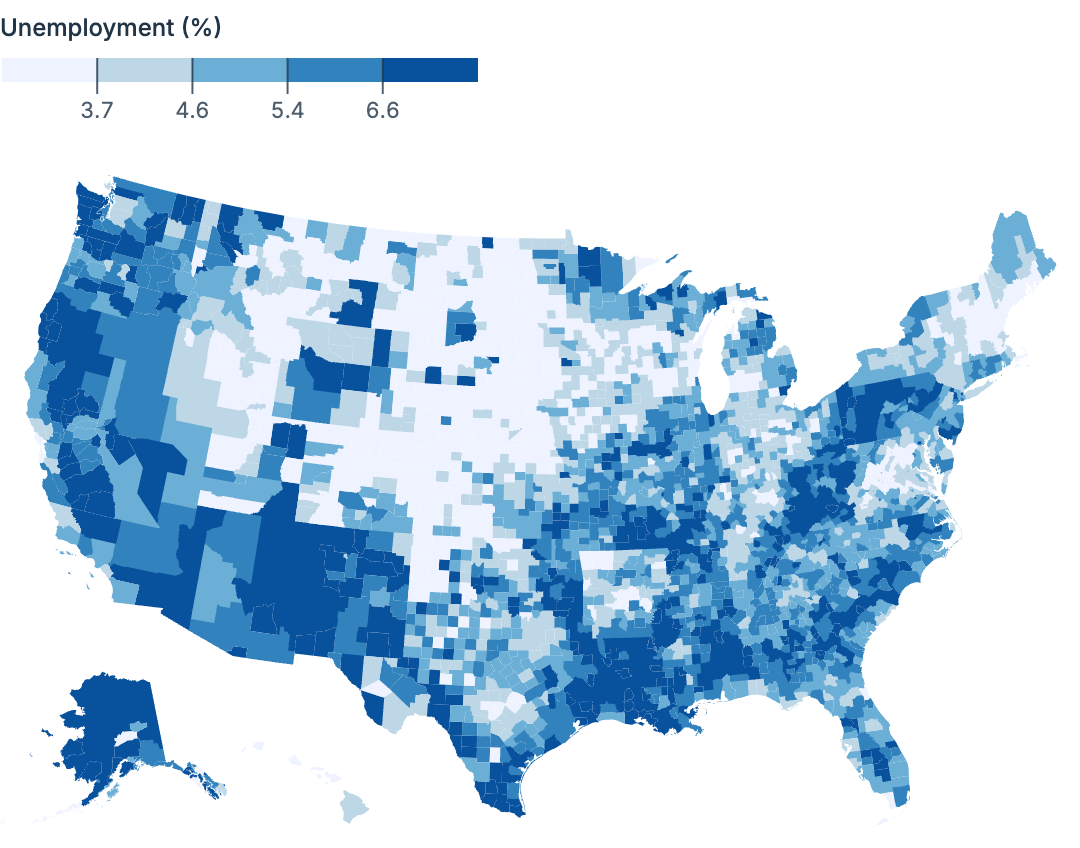
US choropleth map
Earthquakes
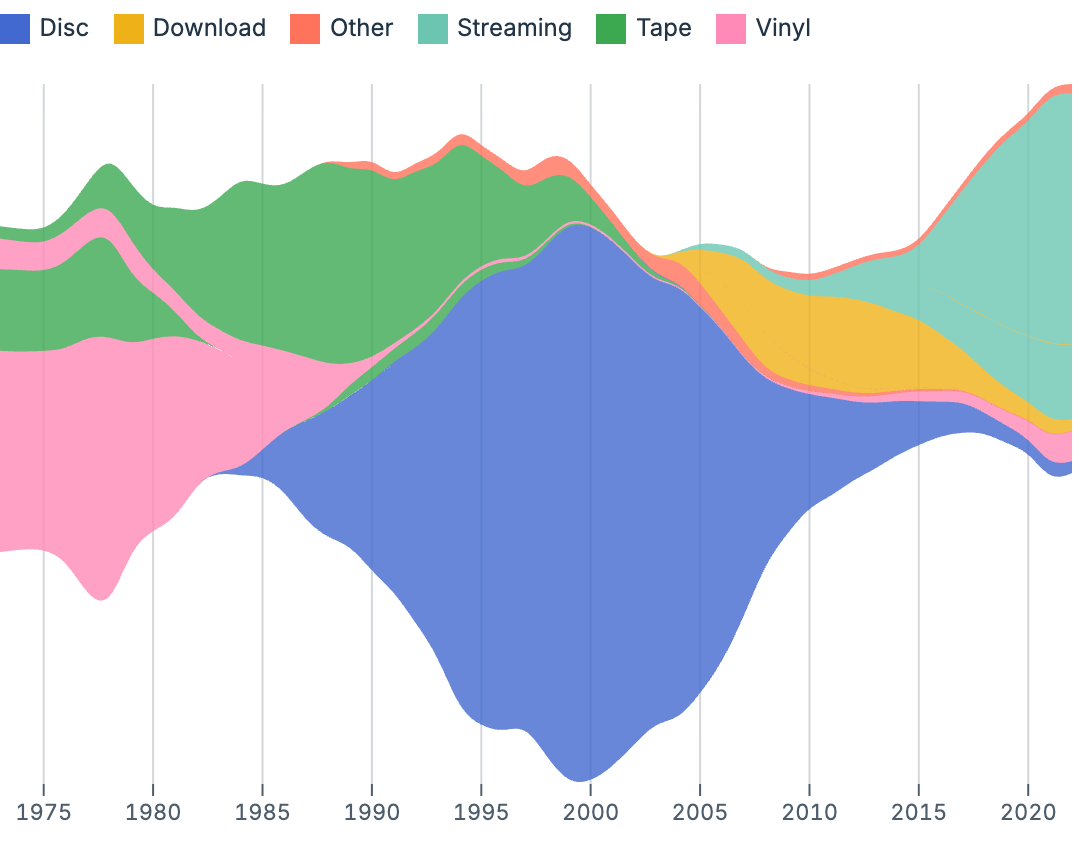
Streamgraph
Grouped regression
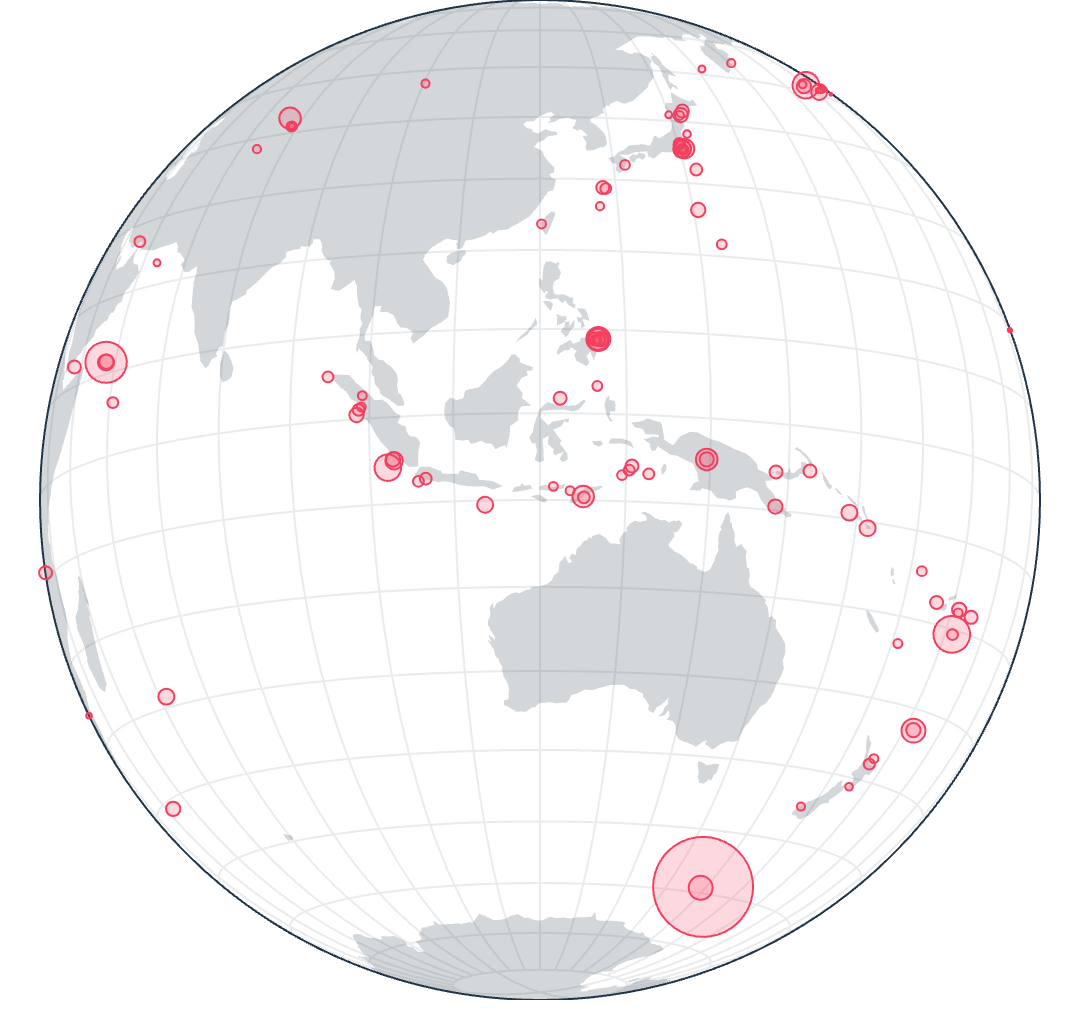
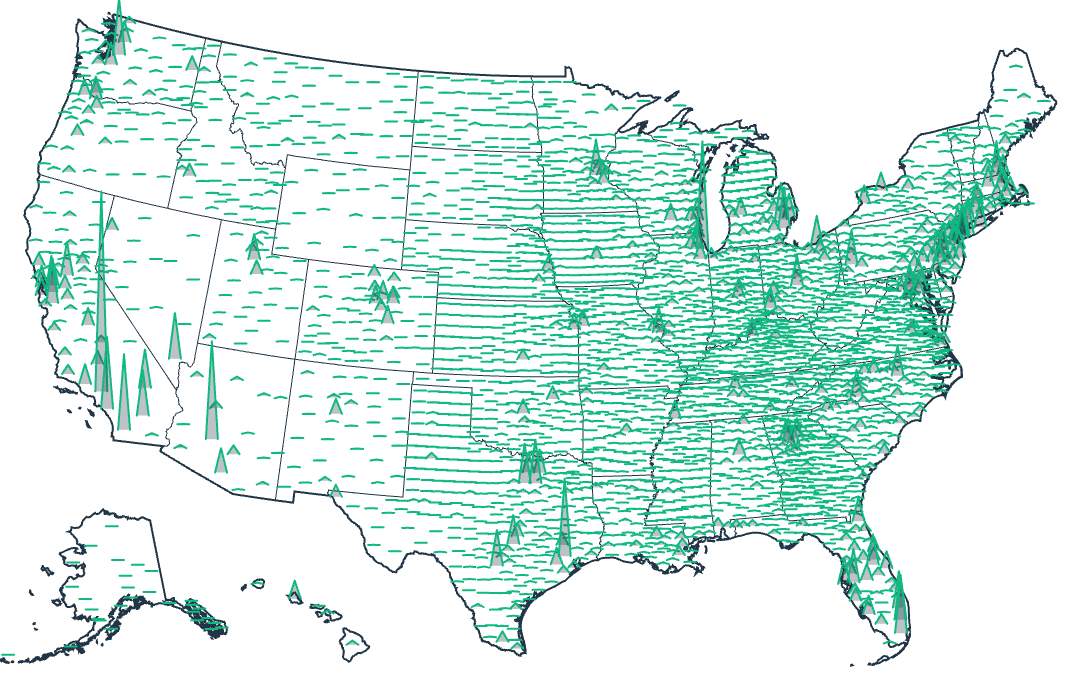
Spike map
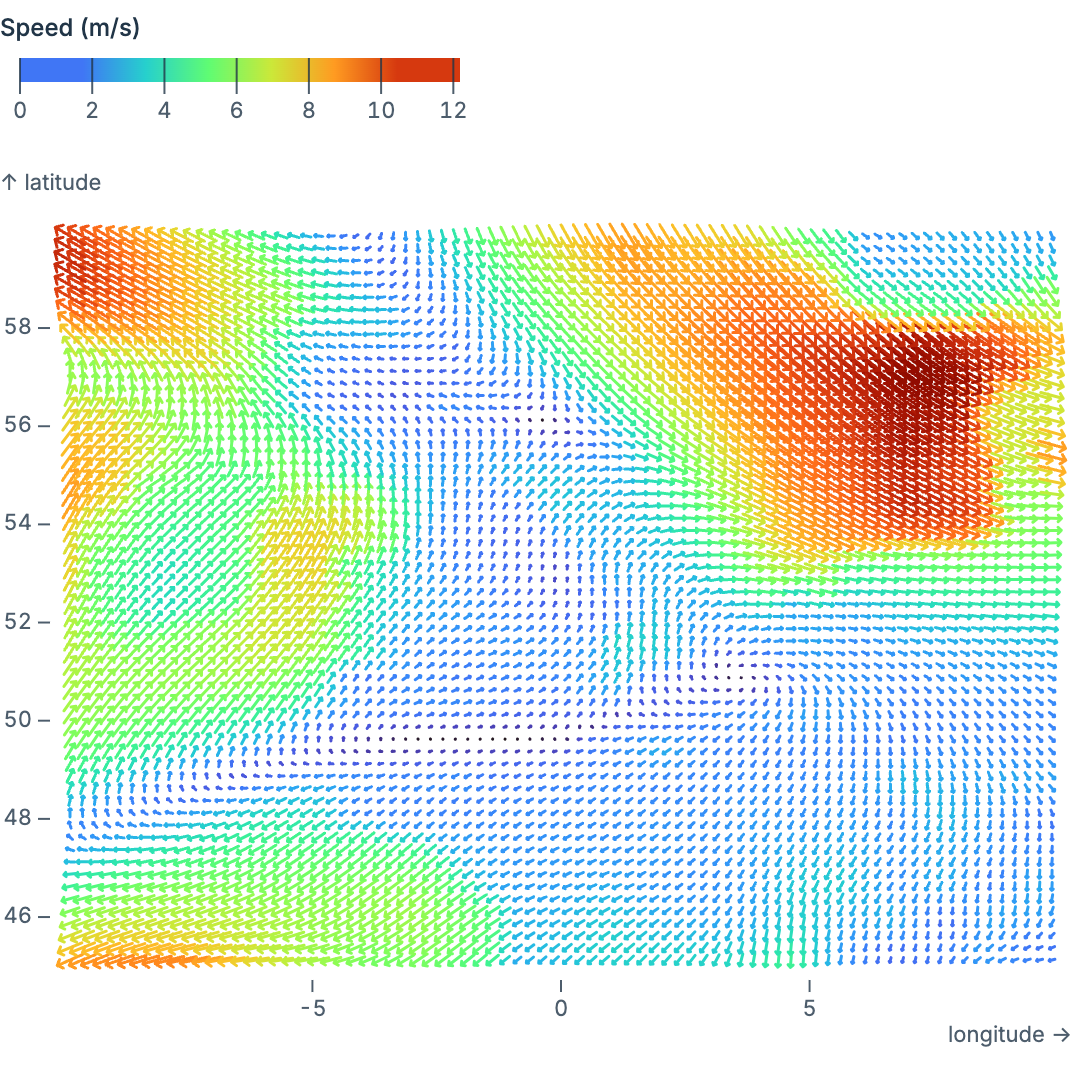
Flow plot
Datawrapper-style ticks
Organized by marks
Area
AreaX
AreaY
Simple area
Events
Area from numbers
Area with point scale
Shifted area
Area with rolling mean
Streamgraph
Arrow
Bended arrows
Axis
Major and minor ticks
Tick classes
Tick count
Tick interval
Tick spacing
Ticks inside
Unit label tick format
Rotated axis labels
Slope chart axis
Datawrapper-style ticks
Bar
Faceted bars
Linked Bars
Shuffled Bars
Stacked Unit Chart
Waterfall-ish
Bar defaults
Dynamic border radius
Box
BoxX
BoxY
BoxX (faceted)
BoxY (faceted)
Brush
Constrained brush
Brush filter
Overview and detail
Zoomable scatter plot
Cell
Cell Plot
Threshold scale
Responsive cells
Custom Marks
Simple rectangles
Histogram with a topline
Multiple SVG marks
Single SVG marks
Dot
Scatterplot
Color scatterplot
Symbol channel
Dot plot
Bubble matrix
Dots from number array
Dots from coordinates array
Beeswarm plot
Beeswarm bubbles
Faceted beeswarm
Frame
Explicit frame
Frame with dx and dy
Frame with ggplot style
Implicit frame
Geo
US choropleth map
US choropleth map (canvas)
Custom projection
Earthquakes
Inset and Aspect Ratio
Grid
Clipped grid lines
Crop grid x lines to data
Crop grid lines to range
Line
Simple line
Geo line
Gradient from categories
Gradient line
Line grouping
Shifted line
Elevation profile
Running mean
Link
Link
Spherical Link
Pointer
Crosshair
Faceted Pointer (1)
Faceted Pointer (2)
Grouped pointer tooltips
Scanline Y
Rect
Simple rectangles
Stacked RectX
Stacked RectY
Binned Rectangles
Mosaic/Marimekko chart
Faceted mosaic chart
Regression
Regression scatterplot
Faceted regression
Grouped regression
Loess regression
Log regression
Rule
Data rules
Min/max rules
Y Baseline
Text
Frame Anchor
CSS variable font size
Tick
TickX
TickY
TickX on quantitative scale
TickY on quantitative scale
Vector
Spike map
Flow plot
Organized by transforms
bin
Histogram with a topline
Min/max rules
Binned Rectangles
Running mean
dodge
Beeswarm plot
Beeswarm bubbles
Faceted beeswarm
geoCentroid
Spike map
select
Running mean
shift
Shifted area
Shifted line
shuffle
Shuffled Bars
stack
Streamgraph
Stacked Unit Chart
Stacked RectX
Stacked RectY
Mosaic/Marimekko chart
Faceted mosaic chart
window
Area with rolling mean
Running mean
Last update at: 2025/10/17 07:54:19